0. Prompt
We have been given a dataset containing sales data for a large storefront across the US.
Our goal is to identify the best locations to pilot test a new product.
Our product is a computer desk with integrated wiring for powering a dual monitor setup with discrete ports for office equipment.
First we will need to clean the data to remove any irrelevant information that may skew the results in an undesirable direction.
Source: Tableau Public

1. Cleaning
I uploaded the raw dataset into MySQL Server as a database so I could manipulate it.
I identified two data sources that would skew our results: returns and irrelevant products.
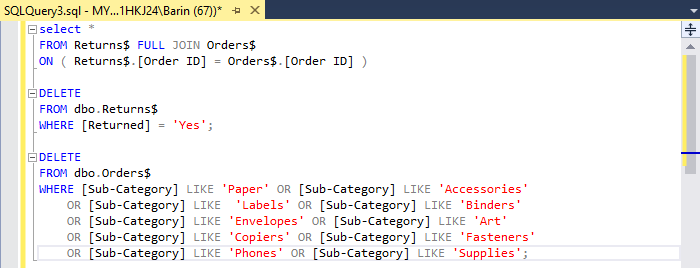
First I queried the distinct Sub-Categories to identify irrelevant products. Our tech-furniture product fits several categories like ‘Furniture, Office Supplies, and Technology’ but does not fit ‘Paper, Envelopes, etc.’
Then I used a FULL JOIN to add a list of returned orders to our table, since the table is only 2 columns, and matched them to the ‘Order ID’.
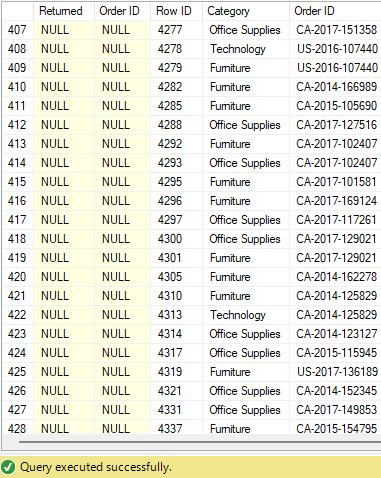
I then deleted any rows flagged ‘Yes’ for returned or irrelevant Sub-Categories. The ‘NULL’ columns confirm there are no returned orders left and skimming the Sub-Category column shows only the remaining categories.

2. Verify
Next I want to be sure the cleaning worked, so let’s check the output.
The ‘NULL’ columns confirm there are no returned orders left and skimming the Sub-Category column shows only the remaining categories.
Now that I am confident the accuracy of our data, I export the query as a CSV file so our visualization software, Tableau, can read the data.
##Tableau does offer datasourcing directly from a database but I do not have a live server to utilize for this project
3. Visualize – Dashboard
Now that we have clean, reliable data, let’s visualize the relevant information and put together a story.
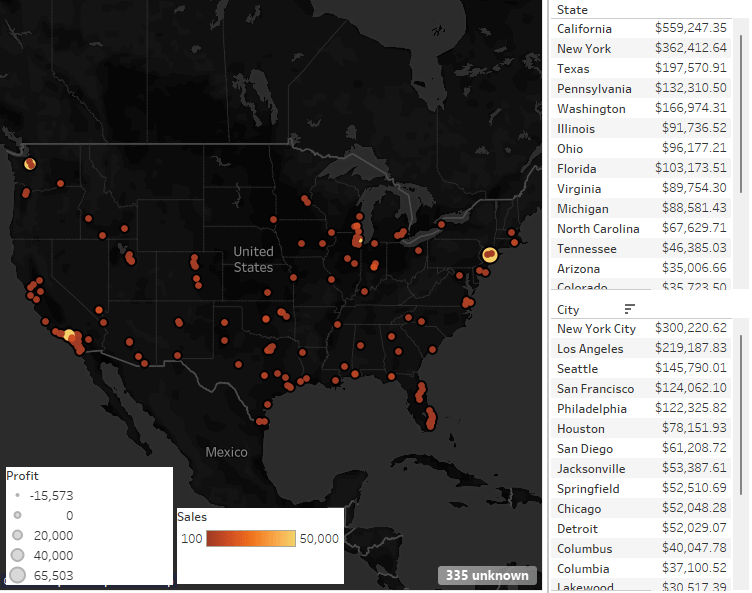
We are looking to identify what markets are safest to introduce our new product, so we likely want the market with the strongest sales or profit for similar products. Our data already excluded dissimilar products so we can safely ignore product information from here-on out and look exclusively to sales information:
I created a geographical map to help visualize grouping of markets by performance (sale$). I also listed the top 20 performing states and cities to help narrow down our options.
4. Next Steps
After presenting the information to leadership and the rest of our team, we can decide if we need more information or begin preparations for distribution.
If the project escalates to production & distribution, we are finished. But let’s assume leadership needs more information and identify new leads to help with the decision.
My first inclination is to identify logistics hubs for our product and company. Depending on our preferred transportation methods, I would compile a list of shipping hubs based on location and relate it our geographical data from sales.
Our product is furniture, which is fairly heavy (i.e. expensive) so we can exclude air-freight from our search. Rail-freight has competitive pricing for heavy products and should be directly compared to trucking.
If our company has warehouses, these should be compiled by geography as well, working with the logistics and shipping departments to identify the best lanes. Lastly we can again visualize the data, easily showing the best performing markets closest to our logistics centers!


